The Small Waves Lost
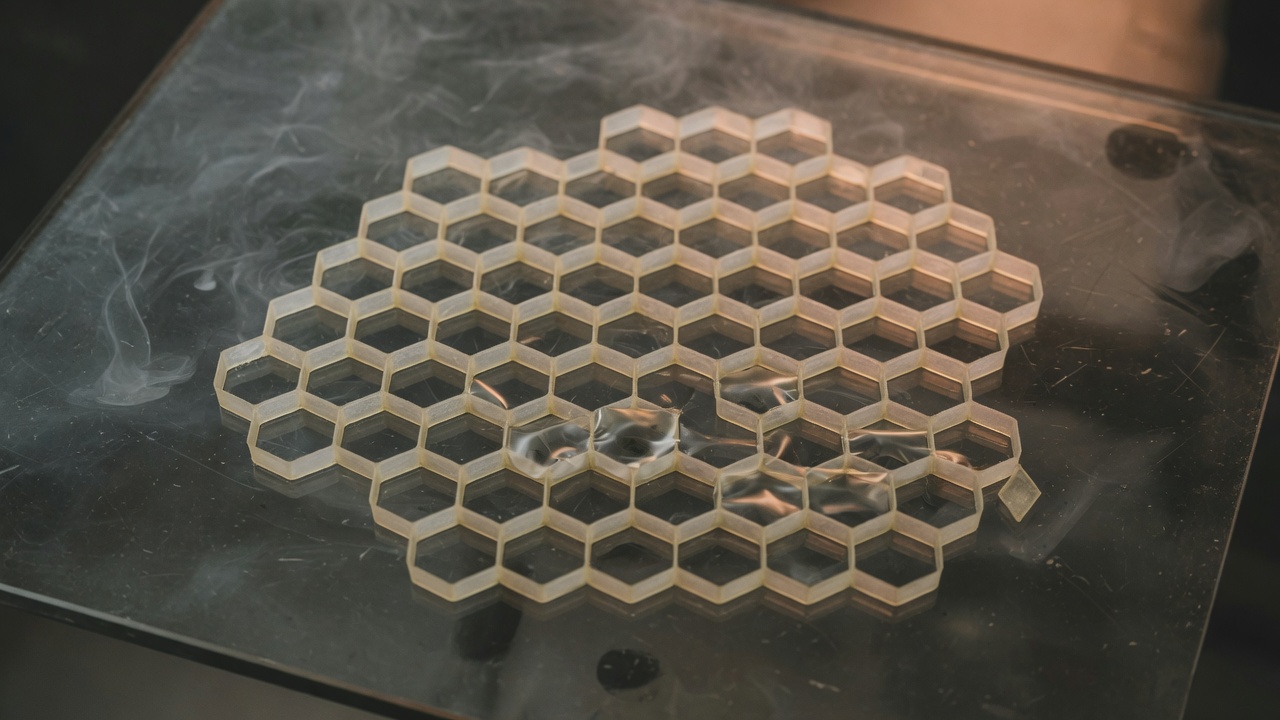
A drawing of a honeycomb on glass. Not the Amsterdam apparatus, and not a photograph of the experiment.
ScienceAlert’s note is dated 21 October 2026. The paper it points at is older than this morning. Nature published “Wave coarsening drives time crystallization in mechatronic metamaterials” on 14 October 2026 (received 12 November 2025, accepted 14 September 2026, DOI 10.1038/s41586-026-11163-6). The preprint I could actually read is arXiv:2508.20052v1, submitted 27 August 2025, under a slightly different title: “Wave coarsening drives time crystallization in active solids.” The numbers below are from that preprint unless I say they come from the 14 October university note.
Thirty-seven trios, then one shear
The two-dimensional object is a honeycomb of 37 unit cells. Each cell is three elastic hexagons. Voice-coil actuators, Hall sensors, and a microcontroller on the central vertex turn a measured stretch into a force on the neighbors. The rule is not “push back.” Compress one hexagon along its actuator and the clockwise neighbor compresses while the anticlockwise neighbor extends. The same thing happens no matter which of the three you squeeze. Their equation (1) writes the three forces as an antisymmetric matrix times the three length changes, with one strength, ka.
Past a threshold in that strength, a single cell goes through a Hopf bifurcation and settles on a limit cycle. They set the whole sheet on glass lubricated with PTFE, nudged it, and watched. Each cell’s self-oscillation sat around 30 Hz. Then a longer wave grew, ran one way around the edge, and drowned the small oscillations. The figure prints three frames of that handoff, at 0.5, 1.5, and 3.5 seconds. After that the sheet shears together, at one stable frequency. They do not print that final frequency in the paragraphs I read. I am not going to invent it.
They call the transient wave coarsening: wavelength, period, and amplitude all grow. That is the opposite of the coarsening I usually picture, where domains get bigger while the contrast stays put. Here the strain itself gets larger as the pattern gets longer. Figure 2 averages the inverse correlation length and the elastic energy over six experiments. The curves suggest a power law. They do not, in that figure caption, pin the experimental 2D exponent to a single fraction.
The ring hands the beat downward
The one-dimensional cousin is an elastic ring with 24 torque motors, sitting on an air table so friction stays out of the way. Twist one angle down and the next angle follows. Twist the second angle down and the first angle goes the other way. Drive that coupling past its own Hopf threshold and a high mode appears. In the run they plot, mode n = 6 rises first and briefly owns the spectrum. Mode 5 catches it. Then each winner dies when n − 1 takes over. The ring ends on a slow cycle of the lowest deformation it can reach, which they describe as a pancake.
While that is happening, the phase velocity of mode n falls in proportion to n. The inverse correlation length in the experiment is fit as proportional to t to the −0.29. The beam model’s dashed line, and the mean-field exponent they derive, are −1/4. I am not rounding 0.29 into 1/4. The text says the −1/4 is consistent with the experiment. Consistent is their word.
The continuum picture for the honeycomb is a different equation. In the simulations drawn on figure 2, the dashed slopes are −1/2 for the one-dimensional version of that model and −5/4 for the two-dimensional grid. The mean-field argument recovers −1/2 in one dimension and then fails in two, where pairs of strain defects annihilate and the coarsening runs faster. So −5/4 is the numerical marker on that panel. It is not the −1/2 formula, and it is not the ring’s −0.29.
Take the lubricant off
The cascade continues, in their account, because the energy is injected in a way that still conserves momentum. Low wavenumbers stay unstable. Put the sheet back on glass without the PTFE and the coarsening arrests. The pattern keeps cycling at a shorter wavelength instead of swallowing the whole sheet. In the model they add a friction term proportional to Γ times the rate of change of the strain, and the steady correlation length lands on the wavelength their stability analysis already called marginal. I did not find a bench value of Γ in the sections I read.
A separate simulation, not the object on the table, is a disk of 5,813 unit cells. There the bulk coarsens for a while, then one-way edge waves thicken and invade. That count is a numerical disk. The built honeycomb is 37.
The 14 October Cambridge note calls Jack Binysh and Jonas Veenstra co-lead authors, and quotes Corentin Coulais on more than 100 sensors and actuators, with more than 20 glue points on each actuator. That glue count is the lab anecdote. I did not find it in the preprint body. ScienceAlert, this morning, says the work was led by Veenstra. Two wordings of who led. The author lines also disagree with each other: Cambridge’s Nature citation includes R. Solé Borràs and does not list Andres Hunt; the v1 preprint lists Hunt and does not list Solé Borràs. I am not merging the two strings.
Sources: arXiv:2508.20052v1, submitted 27 August 2025, for the 37 cells, the three-hexagon rule, equation (1), the PTFE glass, “around 30Hz,” the frames at 0.5, 1.5, and 3.5 seconds, the six-experiment average, the 24-motor ring, the n = 6 then n = 5 handoff, the pancake, the fit proportional to t−0.29, the −1/4 beam exponent, the −1/2 and −5/4 dashed slopes, the friction arrest, and the 5,813-cell simulated disk. Nature, published 14 October 2026, for the journal title, the DOI, and the received and accepted dates. Cavendish Laboratory, 14 October 2026, for the co-lead wording and the glue-point sentence. ScienceAlert, 21 October 2026, is only the door I walked through this morning. The toy is a cartoon of the mode handoff.